Around Navan, a lot of site investigation boils down to understanding the tills. The glacial deposits left across the Boyne Valley can look similar in a bucket but behave completely differently under load depending on their moisture content and clay fraction. That is where Atterberg limits come in. Rather than guessing plasticity from a field hand-roll, we quantify the exact liquid limit and plastic limit of a sample so the design team knows what they are actually working with. A stiff, sandy till from the Drumconrath area and a silty clay pocket near the Blackwater will plot on opposite ends of the Casagrande plasticity chart—and that difference dictates everything from foundation depth to drainage detailing. We also cross-check field descriptions against particle-size data when a grain-size analysis is run on the same borehole material.
A liquidity index above 0.8 in Navan's glacial clays signals that the soil is dangerously close to behaving like a viscous liquid under construction traffic.
Methodology and scope
Local considerations
BS 5930:2015 makes Atterberg classification mandatory for any fine soil that will carry structural load, but around Navan the real risk is differential movement in mixed glacial sequences. A strip footing that transitions from a low-plasticity sandy silt to a high-plasticity lacustrine clay within a few meters will experience uneven heave during wet winters and differential settlement in dry summers. The 1995 revision of TGD Part A (now superseded by Eurocode 7 with the Irish National Annex) tightened the requirements for plasticity index consideration in foundation design precisely because of problems seen in the Midlands. When the liquidity index approaches or exceeds 1.0, the soil loses all undisturbed strength and cannot support trench sides safely—a detail that matters on every Navan housing estate where services are being laid through weathered till.
Applicable standards
BS 1377-2:1990 (Liquid and plastic limit determination), BS 5930:2015 + A1:2020 (Code of practice for ground investigation), Eurocode 7 (EN 1997-1:2004) with Irish National Annex, BRE Digest 240 (Low-rise buildings on shrinkable clay soils)
Associated technical services
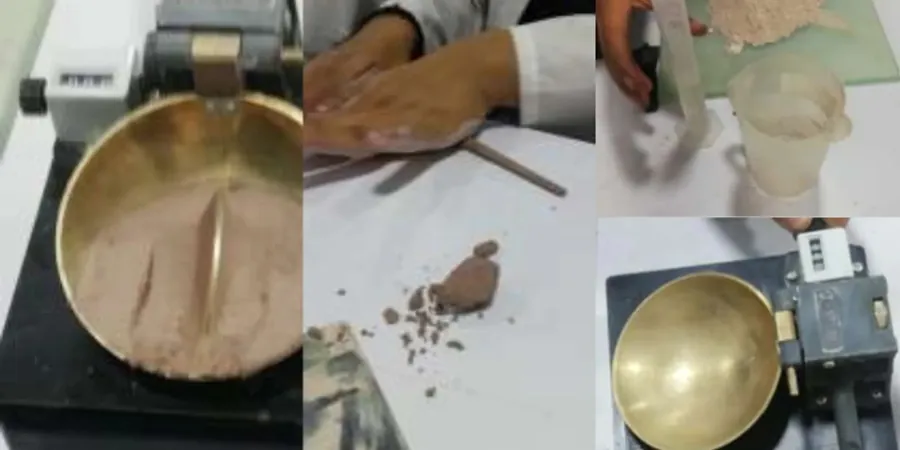
Standard Classification Suite
Liquid limit, plastic limit, and natural water content on a single sample. Includes a plasticity chart plot and BS 5930 soil description. Most common for preliminary site assessments and trial pit logging.
Profile Characterization Package
Atterberg limits at multiple depths from the same borehole, combined with moisture content and bulk density. We plot liquidity index versus depth so you can identify softening zones above the water table.
Shrink-Swell Risk Evaluation
Plasticity index mapping across a site with recommendations for foundation depth adjustment. Pair this with BRE Digest 240 guidance to satisfy building control requirements for low-rise residential developments.
Typical parameters
Frequently asked questions
How long does Atterberg testing take for a Navan sample?
We can typically report Atterberg limits within two to three working days after the sample arrives at the laboratory. The liquid limit cone penetrometer test requires overnight moisture conditioning for cohesive soils, and the plastic limit rolling procedure is done the following morning. Urgent same-week turnaround can be arranged for active construction sites.
What does the Atterberg limits test cost per sample?
Atterberg limits testing in Navan ranges from €60 to €100 per sample, depending on whether you need just the basic liquid and plastic limits or the full package including natural water content, liquidity index, and a plasticity chart report. Discounted rates apply for batch submissions of ten or more samples from the same project.
Can you test silty soils from the Boyne floodplain with this method?
Yes, but with careful preparation. Silts with low plasticity often fall just above the A-line on the chart and can be tricky to roll to a 3 mm thread without crumbling. Our technicians use the BS fallback procedure of recording the sample as non-plastic if the thread cannot be formed at any water content, and we always note the difficulty on the report so the engineer can interpret the result correctly.
Do I need Atterberg limits if I already have a particle size distribution?
Particle size alone tells you the texture, but not the mineralogy or the electrochemical behavior of the clay fraction. Two soils with identical silt and clay percentages can have completely different plastic limits depending on whether the clay is kaolinite or smectite. For any foundation design in Navan's glacial tills, both tests together give the full picture for classification and volume change assessment.